2023
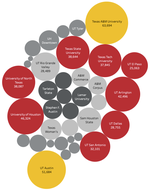
Above All Else Show The Data-Best Practices in Data Visualization
Using Tufte’s principles of graphical excellence to support effective data storytelling and to avoid chart junk.
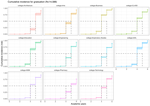
Using Predictive Modeling to Increase Six-Year Graduation
Modeling time-to-graduation using survival analysis.
2022
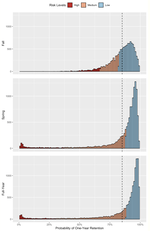
Using Predictive Modeling to Increase One-Year Retention Through Early Identification
How to construct, evaluate, and apply statistical models to predict one-year retention for FTICs.
2020
UH Tableau User Group
University of Houston Tableau Users Group to support, share ideas, and learn from those who are working with Tableau on the UH campus.
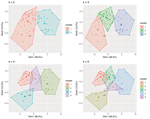
Identifying Institutional Peers Through Cluster Analysis
Using K-means clustering to identify university comparable and aspirational peers.
2019
See the Difference! Visualizing Assessment Data
How to leverage data visualization tools to present assessment data.
2018
Google Charts for Institutional Research
How to construct open-source data visualization with Google Charts using the googleVis package in R.

