See the Difference! Visualizing Assessment Data

Abstract
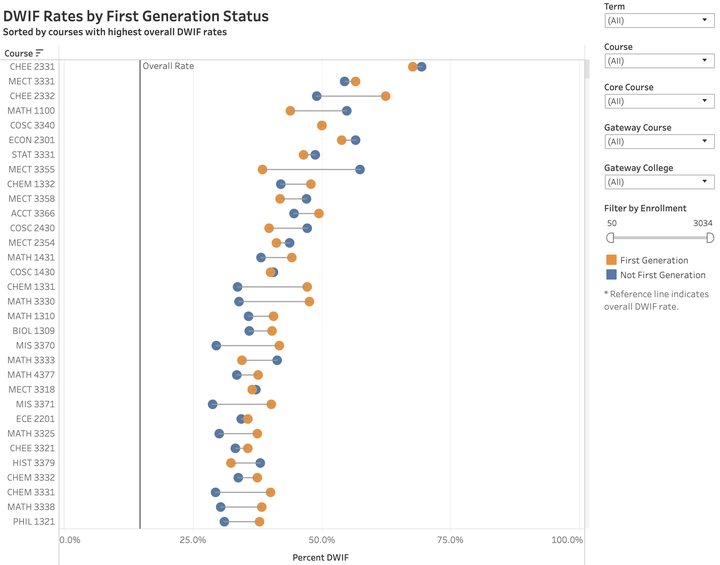
Visual analytic tools are valuable in supporting the assessment function within institutions. In this session, we give examples of how these tools can be leveraged to present assessment data and discuss best practices for building visualizations and dashboards. Although we will use Tableau for demonstration, the lessons presented can be generalized to any data visualization tool and for any type of data.
Date
Feb 26, 2019 3:30 PM — 4:15 PM
Location
Horsehoe Bay Resort
200 Hi Circle North, Horseshoe Bay, TX 78657